For almost eight months the OpenStreetMap (OSM) community has been collecting geo information for the West Africa Ebola outbreak response now. The collective work of the crowd is somewhat managed by the Humanitarian OpenStreetMap Team (HOT). For example, the Task Manager provided by HOT gives interested contributors information in which areas map features are needed. However, you can find additional information in an article by Pierre Beland, which he wrote during a conference where he presented the efforts of the OSM community. The OSM wiki contains some useful information about the West Africa Ebola Response too. Matt Irwin also wrote a summary about the OSM mapper contributions and created an interesting visualization of all the mapping work.
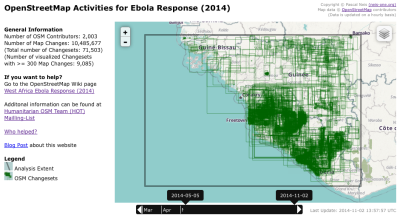
I created a response map for the OSM mapping activities in West Africa, a similar approach as I previously used for the “Typhoon Haiyan” deployment. It displays all OSM changesets created since March 1st, 2014. The analysis extent is displayed by a black rectangle. In total, more than 2,000 contributors made more than 10 million changes to the map. At the bottom you will find a time range slider which can control the displayed changesets. Sorry for the sometimes slow performance, but the community (maybe you too) collected a huge amount of data! The map is online here: http://resultmaps.neis-one.org/osm-ebola
A complete list of all OSM contributor names with their number of map changes can be found here. It’s really fantastic, “Thank you & keep up the good work!”. This time I have also spent some time to analyze what type of contributors helped in this scenario. The following diagram shows the number of contributors per month in the above mentioned analysis extend. Additionally, it contains information on how long the individual contributors have been collecting map data. In contrast to the first months, many new members contributed data in the past three months.

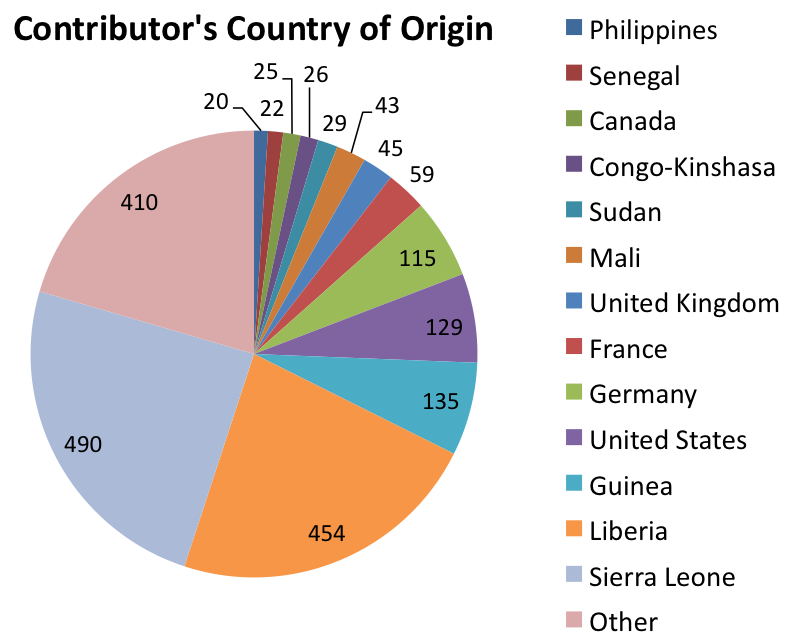
Based on the information from “How did you contribute to OSM“, which shows in what country a member performed the most map changes, I created the following chart. It displays the distribution of the contributor’s countries of origin. I assume that the high number of new registered members, who created many changesets during their Ebola response, moved their origin towards West Africa. However, overall more than 2,000 contributors from almost 110 countries helped so far, AWESOME! What do you think?
Lastly, I would like to point to the following blog post which shows you how to search for changesets with a specific comment for any region of the world: “Filtering OpenStreetMap Changesets by a Specific Comment“.
Thanks to maɪˈæmɪ Dennis.
Comments
5 responses to “Ebola Response Map and OSM contributor analysis”
Nice post! How did you get the registration date for each user? I also would like to know how you define a change. Is deleting a node a change? Is adding a tag a change? I’m working on something similiar, so this is quite exciting for me.
Hi Gideon,
thank you very much for your comment. I didn’t use the registration date of each contributor. But you can get it here[1]. I used the timestamp of the first created changeset. Right, every modification (create/modify/delete) of an OSM object (Node/Way/Relation) is a map change. For the sums I used the “num_changes”-attribut of the changesets (complete dump[2] or replication files [3]).
I hope that it helps you.
All the best,
Pascal
[1] http://wiki.openstreetmap.org/wiki/API_v0.6#Details_of_a_user
[2] http://planet.openstreetmap.org/planet/
[3] http://planet.openstreetmap.org/replication/changesets/
Trying to use the contributor analysis page for a project I had my student do and it keeps coming back with the error that their username could not be found. It works with mine though.
Hi Kristine, thank you very much for your comment. I assume that they are newly registered OSM contributors, right? Maybe you should give it a try again in the next days.
All the best,
Pascal
[…] And informative, Ebola Response Map and OpenStreetMap contributor analysis […]