-
Checking OpenStreetMap Notes for Potentially Problematic Language
Over the past few months, I have been experimenting with various open-source language models. I often use Ollama for this, as it is easy to install and can be integrated well into custom workflows. As part of several quality analysis and quality assurance ideas around the OpenStreetMap (OSM) project, I wanted to explore whether large language…
-
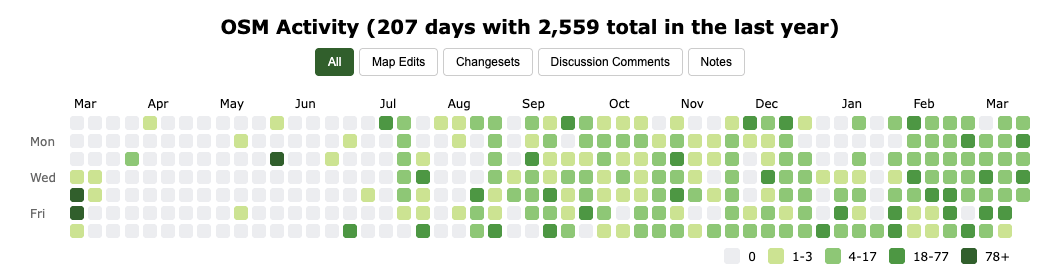
Beyond Mapping with the OSM Activity Calendar
In 2010, I started “How did you contribute to OpenStreetMap?” (HDYC) as a fun side project. Even after more than 15 years, it is still great to see that this website is being used by so many people from the OSM community and even in academic research. Some features were implemented based on community feedback.…
-
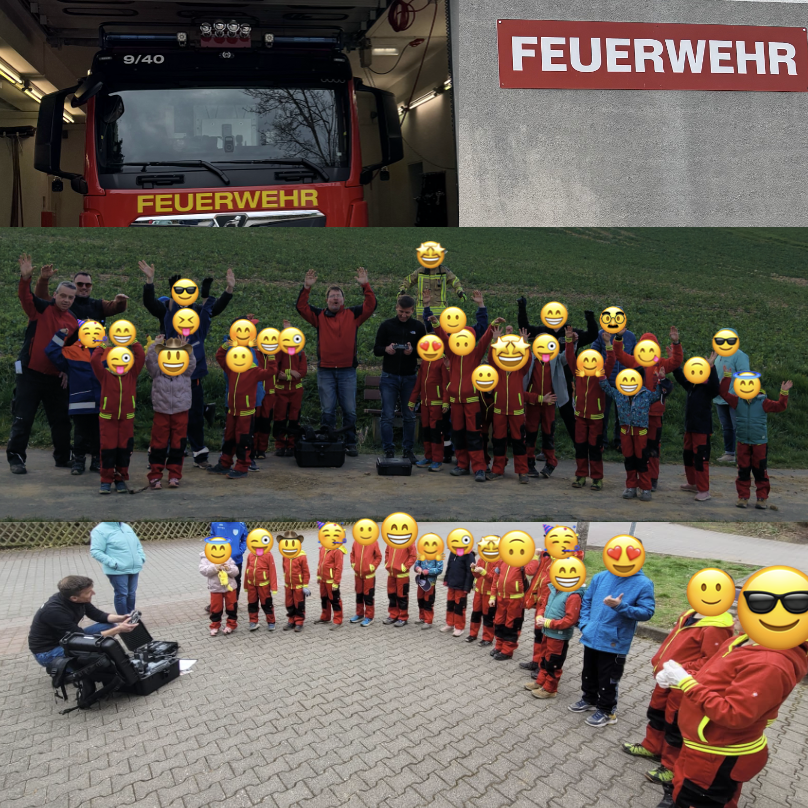
Ein Abenteuer mit der Thermaldrohne: Kinderfeuerwehr auf Vermisstensuche
Drohnen sind aktuell in aller Munde. Leider allerdings eher im Kontext weltweiter Konflikte und geopolitischer Spannungen. Auch wenn ihr Ursprung in der militärischen Entwicklung liegt, werden sie heute vielseitig eingesetzt: zur Freizeitgestaltung, in der Vermessung sowie bei Hilfsaktionen. Genau hier möchte ich anknüpfen. Durch die Hochschule Mainz habe ich Zugriff auf unterschiedliche Drohnensysteme. Von Fluggeräten…
-

From Planet File to Vector Tiles: Benchmarking My OpenStreetMap Processing Pipeline
TL;DR: I benchmarked my OpenStreetMap processing pipeline (Osmosis → Osmium → Tilemaker) across four machines. Updating the planet takes ~16–21 minutes, while generating worldwide vector tiles (z14) takes between 1h45 and 6h18 depending on hardware and parameters. With tuned Tilemaker parameters and sufficient RAM I was able to reduce tile generation to ~1h45. The Full…
-
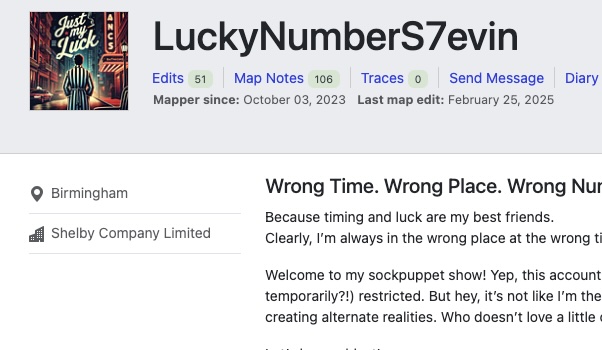
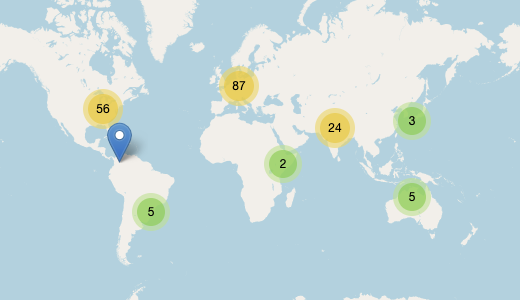
Who and Where? Analyzing the New Company and Location Fields in OpenStreetMap Profiles
In May 2025, the OpenStreetMap (OSM) website introduced two optional fields in public user profiles: company and location (see Github). Both fields accept unstructured free text and are not validated in any way. Since these fields are publicly visible, I wondered whether they could be useful for my “How Did You Contribute to OpenStreetMap?” (HDYC)…
-
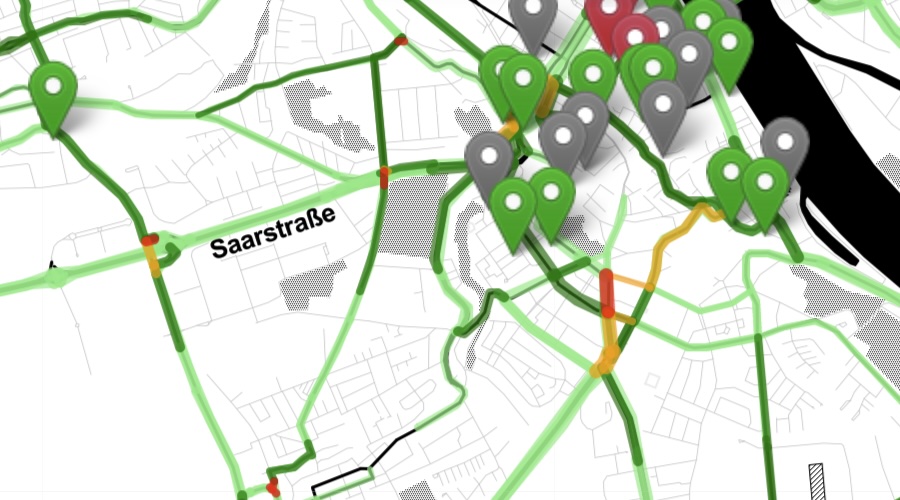
KI für die urbane Mobilität: Lehrforschungsprojekte am Beispiel der Stadt Mainz
Die digitale Transformation wird oft abstrakt diskutiert. Mich hat jedoch eine praktische Frage beschäftigt: Wie kann ich in meiner Lehre zeigen, dass (Geo)Daten, Algorithmen und künstliche Intelligenz tatsächlich zur Lösung urbaner Herausforderungen genutzt werden können? Mir ging es dabei nicht nur um theoretische Konzepte, sondern um anwendungsnahe Lehrforschung: realen Daten, greifbare Fragestellungen und idealerweise einen…
-
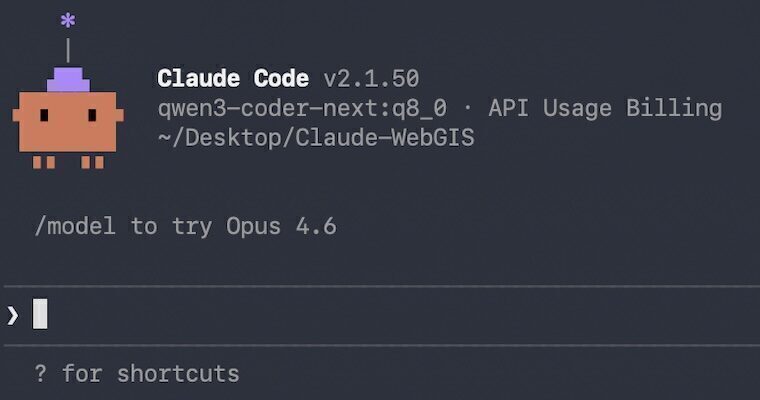
From Flappy Birds to WebGIS: Testing Coding Assistants in a Local LLM Workflow
Until recently, I used generative AI (GenAI) for programming almost exclusively through the browser in the form of ChatGPT, Gemini, or via my own Ollama backend. My typical use cases ranged from “I need a function or a script that does …” to “There’s a bug in the following lines, how could I fix it?”…
-
Adding the Missing Dimension: Position Tracking for Vehicle Data Logging
In one of my previous blog posts, I explored how to read live vehicle data through the OBD II port that is present in most (modern) cars. As mentioned in the outlook, the next step in my project is to combine vehicle telemetry with (accurate) positional information in order to enable more advanced analysis. To…
-
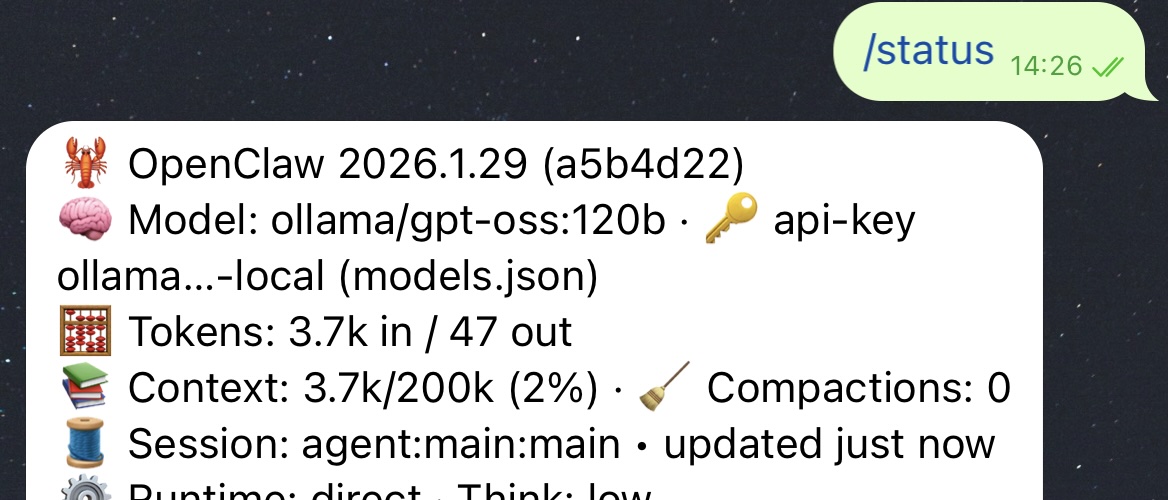
Yes, the Hype Is Real: Building a Local AI Assistant with OpenClaw
Starting point: A colleague asked me on Friday morning: “Do you know OpenClaw?” After about ten minutes of internet research, everything was clear again and my weekend was at least partly gone. “Total escalation” on my side. What is OpenClaw? After Clawd and Moltbot, now OpenClaw. In short, OpenClaw is an open source framework for…
-
What’s your car really doing? Getting real time data and insights
Some people are curious about how healthy their car really is, while others take their vehicles onto the racetrack where it is essential to avoid overheating or pushing components far beyond their comfort zone. You can, of course, buy small aftermarket performance data displays that many cars support, but some friends would rather save the…