-
What’s your car really doing? Getting real time data and insights
Some people are curious about how healthy their car really is, while others take their vehicles onto the racetrack where it is essential to avoid overheating or pushing components far beyond their comfort zone. You can, of course, buy small aftermarket performance data displays that many cars support, but some friends would rather save the…
-

Data Science für soziale Innovation? RLP NEXT
Am Montag, den 6. Oktober, durfte ich beim RLP NEXT Innovationkongress in Mainz einen Vortrag mit dem Titel „Data Science für soziale Innovation?“ halten. Im Gepäck hatte ich fünf kurze Geschichten aus der Landeshauptstadt des Landes Rheinland-Pfalz – rund um Open Data, Künstliche Intelligenz und nachhaltige Stadtentwicklung. Mein Hauptziel: dem Publikum auf der Innovation Stage…
-

“Shaping Geospatial Futures”? – Mit KI-gestützten Analysen in der Kriminalitätsforschung
Vom 2. bis 3. Juli fand in Salzburg die jährliche AGIT-Konferenz für Geoinformatik statt. Unter dem Motto „Shaping Geospatial Futures“ versammelten sich mehrere hundert Besucherinnen und Besucher aus dem deutschsprachigen und internationalen Raum. Auch wenn ich nicht jedes Jahr dabei war, zeigt ein Blick in meine Unterlagen: Mein erster Beitrag auf der AGIT (ein Poster)…
-
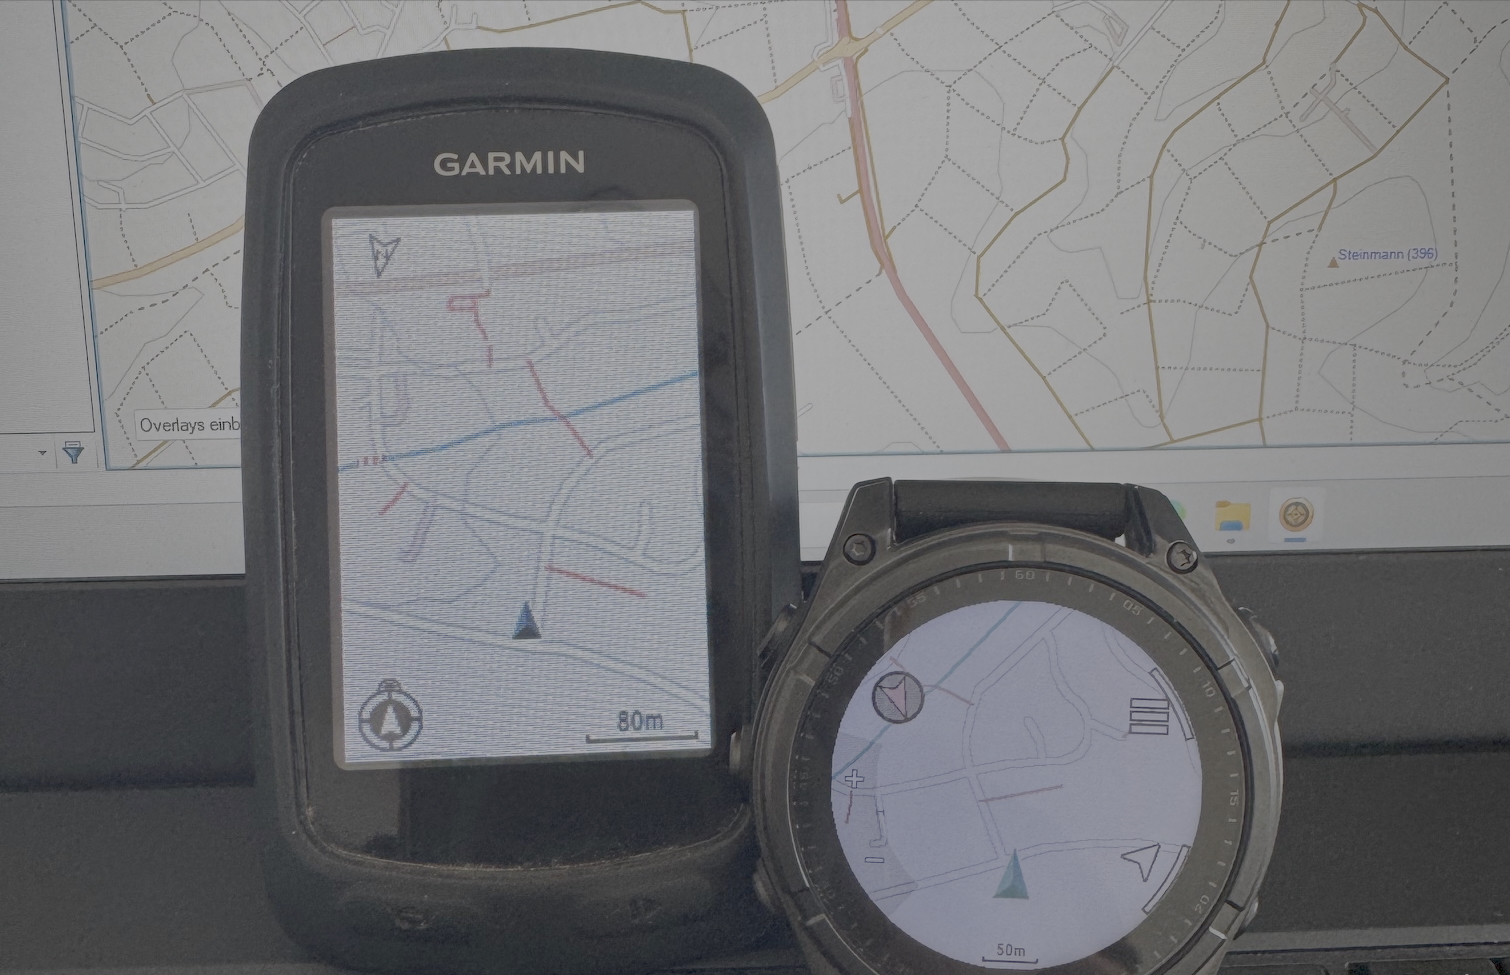
From Sky to Trail: Testing GPS Accuracy with Drones, Action Cam and Smartwatch
In the early days of mapping and cartography experiments, GPS tracks were often the starting point. Contributors to the OpenStreetMap (OSM) project, especially before 2010, relied heavily on GPS devices. They would walk or cycle routes and later upload their recorded tracks and observations to OSM. Today, GNSS-capable devices are everywhere: smartphones, smartwatches, action cams,…
-
Building My Own Garmin™ Maps for Outdoor Activities Based on OpenStreetMap Data
For many years, I’ve used pre-made Garmin maps from the internet on my devices while hiking, running, or mountain biking. These maps have always been based on data from the OpenStreetMap (OSM) project. In the early days, a map of Europe was just a few hundred megabytes in size and usually fit comfortably on the…
-
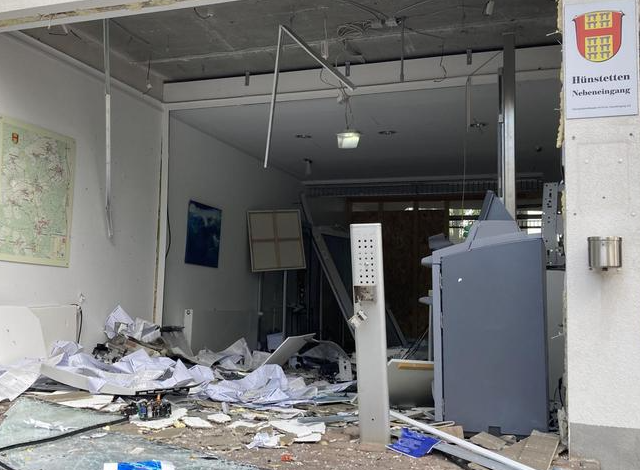
Zwischen Wissenschaft und Kriminalität: Geldautomatensprengungen in Rheinland-Pfalz & Hessen
In den vergangenen Jahren kommt es in der gesamten Bundesrepublik Deutschland immer wieder zu Geldautomatensprengungen. Das Bundeskriminalamt veröffentlicht hierzu jährlich ein Bundeslagebild, das sowohl deskriptive Statistiken als auch weitere Informationen zu den Vorfällen in den einzelnen Bundesländern bietet. Auch in meiner Heimatgemeinde Hünstetten wurde bereits mehrfach ein Geldautomat gesprengt und ausgeräumt. Für mich persönlich war…
-
Unmapped Places of the OpenStreetMap World – 2024
In 2010, I first conducted a study which identified regions (places) in the OpenStreetMap (OSM) project in Germany that still had potential for more detailed mapping. Later, in 2016, this analysis was repeated and extended to the entire world. I have since regularly carried out these studies and published the results. The algorithm and some…
-
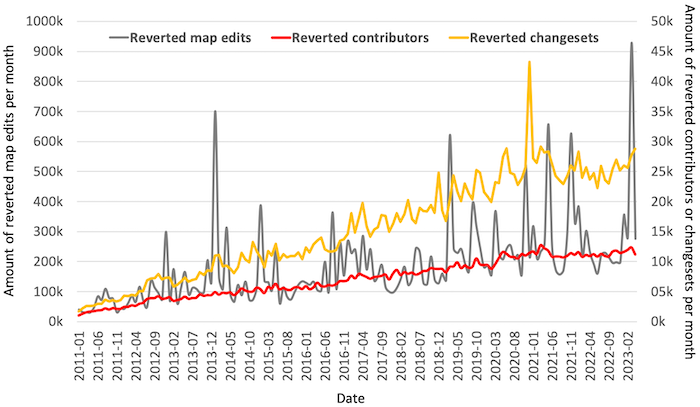
Wait, someone did what?
Exploring Reverted Map Edits in OpenStreetMapThe OpenStreetMap (OSM) project has over 10 million registered members, with around 2 million user profiles having made at least one map contribution. However, a closer look reveals that there has been a slight decline in the number of active contributors over the last three years. Despite the extensive global mapping community, there are instances…
-

OpenData vom Bundesamt für Kartographie und Geodäsie vs. Crowdsourced OpenStreetMap in Deutschland – Ein Vergleich Offener Daten
Nach knapp 1.000 Tagen Abstinenz (endlich?) mal wieder ein Blog Post von mir. Aufgrund des inhaltlichen und räumlichen Bezugs diesmal auf deutsch. Ein „offizieller offener“ Datensatz von einer Bundesbehörde? Gut, wie sieht’s im Vergleich zu gemeinsam zusammengetragen Daten aus, z.B. OpenStreetMap? Lassen sich Unterschiede in der Qualität feststellen? Sind die Datensätze womöglich auf Augenhöhe oder…
-
#100 – Thank you!
While I was working on my latest blog post, I realized that I had already written 100 posts over the past nine years. All posts have one thing in common: They are about the well-known and maybe never ending OpenStreetMap project …