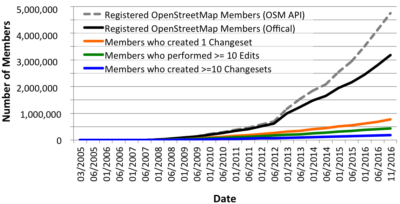
Over the past few years I have written several blog posts about the (non-) activity of newly registered OpenStreetMap (OSM) members (2015, 2014, 2013). Similarly to the previous posts, the following image shows the gap between the number of registered and the number of active OSM members. Although the project still shows millions of new registrations, “only” several hundred thousand of these registrants actually edited at least one object. Simon showed similar results in his yearly changeset studies.
The following image shows, that the project still has some loyal contributors. More specifically, it shows the increase in monthly active members over the past few years and their consistent data contributions based on the first and latest changeset:
However, this time I would like to combine the current study with some additional research. I tried to identify three different OSM contributor groups, based on the hashtag in a contributor’s comment or the utilized editor, for the following analysis:
- Contributors of the MissingMaps-Project: A contributors of the project usually use #missingmaps in their changeset.
- Contributors that utilized the Maps.Me app: The ‘created_by’-tag contains ‘MAPS.ME’.
- All other ‘regular’ contributors of the OSM project, who don’t have any #missingmaps in their changesets and neither used the maps.me editor.
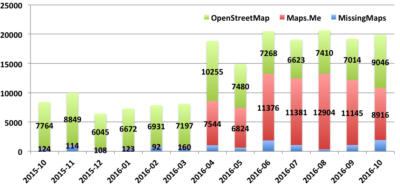
In the past 12 months, almost 1.53 million members registered to the OSM project. So far, only 12% (181k) ever created at least one map edit: Almost 12,000 members created at least one changeset with the #missingmaps hashtag. Over 70,000 used the maps.me editor and 99,000 mapped without #missingmaps and the maps.me editor. The following diagram shows the number of new OSM contributors per month for the three aforementioned groups.
The release of the maps.me app (more specifically the OSM editor functionality) clearly has an impact on the monthly number of new mappers. Time for a more detailed analysis about the contributions and mapping times: The majority of the members of the groups don’t show more than two mapping days (What is a mapping day, you ask? Well, my definition would be: A mapping day is day, where a contributor created at least one changeset). Only around 6% of the newly active members are contributing for more than 7 days.
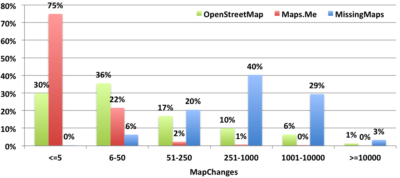
Some members of the #missingmaps group also contributed some changesets without the hashtag. But many of those members (70%) only contributed #missingmaps changesets. Furthermore, 95% of this adjusted group doesn’t map for more than two days. Anyway, despite identifying three different contributor groups, the results are looking somewhat similar. Let’s have a look at the number of map changes. The relative comparison shows that the smaller #missingmaps group produces a large number of edits. The maps.me group only generates small numbers of map changes to the project’s database.
Lastly, I conducted an analysis for three selected tag-keys: building, highway and name. The comparison shows that the #missingmaps group generates a larger number of building and highway features. In contrast “regular” OSM’ers and maps.me users contributed more primary keys such as the name- or amenity-tag.
I think the diagrams in this blog post are quite interesting because they show that the #missingmaps mapathons can activate members that contribute many map objects. But they also indicate that the majority of these elements are traced from satellite imagery without primary attributes. In contrast the maps.me editor functionality proofed to be successful with its in-app integration and its easy usability, which resulted in a huge number of new contributors. In summary, I think it would be good to motivate contributors not only to participate in humanitarian mapathons but also to map their neighborhood in an attempt to stick to the project. Also, I guess it would be great if the maps.me editor would work on the next steps in providing easy mapping functionality for its users (of course with some sort of validation to reduce questionable edits).
Thanks to maɪˈæmɪ Dennis.


Comments
23 responses to “A comparative study between different OpenStreetMap contributor groups – Outline 2016”
What is your source for Registered OpenStreetMap members (OSM API)? The API does not directly return the number of registrations, only information about OpenStreetMap contributors, which is the same data you get if you analyze the changeset dumps.
Hi Paul, thanks for your comment.
Source for ‘Registered OSM Members (Official)’ -> https://www.openstreetmap.org/stats/data_stats.html
Source for ‘Registered OSM Members (OSM API)’ -> https://wiki.openstreetmap.org/wiki/API_v0.6#Details_of_a_user
It’s not the same data as in the changeset dumps. The API also contains information about members who didn’t contribute to the project.
All the best, Pascal
The ID of a user is not an indication of the number of users who have registered, except as an upper bound. The ID comes from a postgresql serial, and the only guarantee is that each time an ID is generated it increases*. The only place to get the number of people who have registered is from the data_stats page.
* Leaving aside concurrency issues
I didn’t write, that I used the ID to calculate the number of users. Again, I used the mentioned API to get registered OSM members. Try it yourself, start with 1 and the mentioned API. For me, an user will be counted, if the API returns an username and a registration date.
Why did you filter by missing maps and not hotosm? Almost all missing maps tasks contain a hotosm reference, but a lot of hotosm tasks aren’t missing maps. (4812 people working on hotosm vs 3661 on missing maps over the last 30 days)
Hi Joost, thanks for your comment.
I tried to separate MM and HOTOSM. As Dale already mentioned below, a 4th group with HOTOSM could be a possible.
All the best, Pascal
The graph with the number of mapping days seems to show that the level of engagement is similar between the three groups: new ‘regular’ mappers are no more or no less hit-and-run than humanitarians or maps.me editors. Nice to see a number for that, a lot of people assume these groups to be very different in level of engagement.
Almost correct, but the total amount of contributors is quite different.
Did you see the following sentence?
‘But many of those members (70%) only contributed #missingmaps changesets. Furthermore, 95% of this adjusted group doesn’t map for more than two days.’
I don’t see how the total number is significant with regards to my statement? All I’m saying: of the three kinds of mappers, you lose about 70% after their first day.
So the 95% is a percentage of the 30% of missing mappers who did do something without #missingmaps? So #missingmaps people who also map outside the missing maps are actually less likely to keep mapping? That would be quite weird, and might warrant some closer inspection (maybe they are having trouble getting the changeset comments right, rather than mapping their home)
> So the 95% is a percentage of the 30% of missing mappers who did do something without #missingmaps?
correct
If we take all the mappers with more than one mapping day, how much overlap is there between the groups? Maps.me users go on to edit using another editor? How many humanitarians go on to map something else? To me, that would be key performance indicator. Especially if you could identify their home location somehow.
As already mentioned, regarding the number of mapping days, I guess the groups are similar. However, 70% of the #MissingMaps contributors only edited for the MM project. Furthermore, 95% of the Maps.Me group only contributed with the Maps.Me editor.
Thanks for the extra statistic!
5% of about 70.000 new maps.me contributors still means about 3500 new “normal” mappers through mapsme. On a yearly basis, if they keep it up at this rate, that would mean an extra month’s worth of new “normal” mappers per year. Given how the number of new mappers doesn’t really seem to increase since 2014, that is still significant.
Of course, if maps.me could somehow get that percentage up to 10 or 15%, they could really enhance their impact.
Also, the 5% will automatically increase when you rerun this analysis in a couple of months, as the average mapsme contributor has only had about 3 months to do something, whereas the average “regular” contributor has had about 6 months. It probably won’t make that big of a difference (and you could already have an idea of that, based on the behavior of people who did have more than 3/6 months to act.
On the three graphs next to each other: scale them all to 100%, than they will be easier to read 🙂
In those graphs: the 2% and 7% maps.me people who edited buildings and roads, that would be people whose first changeset is in maps.me and went on to edit in an editor like iD or JOSM. A rather low number, but sounds plausible.
Great work as always Pascal. Reading this over I do have a couple of questions.
1. I think showing HOT without MM would be a great 4th column to view the data from as all MM tasks are HOT tasks but not the other way around. This would seperate out the disaster mapping from the rest of OSM.
2. 181k new mappers – 70k Maps.Me mappers = 111k mappers. So MM is roughly 10% of all new mappers that contribute non-mobile edits.
3. Based on the edits by year sign up cohort it seems that project wide we tend to keep the same number of users year over year.
I totally agree that MM and HOT needs to continue to make sure that new mappers are plugged into the larger OSM project. Its something we emphasize at mapathons and other events. We often show people that are interested how to map their own communities, where they live, or where they are from originally.
Great work as always and I look forward to future studies like this. Please let me know if any of the data from MM would help future studies.
Hi Dale, thanks for your comment.
1.) Yes, I totally agree, this could be a good idea and has been mentioned from Joost too.
2.+3.) Yes, I think so.
Hope that it helps you.
All the best, Pascal
Great post Pascal, thanks a lot!
I had no idea so many people contributed by maps.me, I think in future mapathons we will highlight more this type of tools that are a way to connect humanitarian mappers to local mapping (we already always mention and invite when possible local mappers, but don’t systematically present mobile tools).
Hi Pascal,
Sorry for all the spam here, but… 🙂
– could I get some of the processed data behind these graphs? Especially for the first graph
– talking to some fellow mappers at a mapathon yesterday, they asked if it would be the same four “our” mapathons (or better or worse than avarage). Do you think it’s possible to get some semi processed data where you can still see the tags of the first changeset (as to identify our task numbers) as well as their subsequent behaviour? If not, some pointers as to what is needed for similar analysis would be great – I only have experience with history files, not with changeset dumps.
Hi Joost,
> talking to some fellow mappers at a mapathon yesterday, they asked if it would be the same four “our” mapathons (or better or worse than avarage). Do you think it’s possible to get some semi processed data where you can still see the tags of the first changeset (as to identify our task numbers) as well as their subsequent behaviour?
sure, which data do you exactly need? Do you have a hashtag of your mapathons?
All the best,
Pascal
I’m happy with relatively raw data, preferebly with some stuff already geocoded.
It took me a little longer then expected to collect our task numbers. Pretty cool to see we’ve been involved with 12 mapathons over the last 12 months 🙂
Here’s the list of tasks and the day we had a mapathon with that task. There will still be some pollution with people who happened to start mapping on the same day on the same task.
9/12/2015 1301
23/01/2016 1396
19/03/2016 1576
23/03/2016 1655
16/04/2016 1779
16/04/2016 1777
16/04/2016 1776
16/04/2016 1775
16/04/2016 1576
6/06/2016 1933
6/06/2016 1932
6/06/2016 1926
29/06/2016 1968
22/09/2016 2116
22/09/2016 2117
22/09/2016 2164
22/09/2016 2171
26/10/2016 2256
15/11/2016 2299
Here u go:
All Changesets of the mentioned #HOTOSM projects since 1.1.2015:
http://tools.neis-one.org/tmp/20161126_hotosm-project.txt
List of contributors with their first/latest changeset and mappingdays:
http://tools.neis-one.org/tmp/20161126_hotosm-contributors.txt
Hope that it helps you.
All the best, Pascal
ps: without warranty 🙂
Thanks, will post back here if I can make something useful with it!
(there’s no subscription to comments here, hence the slow response!)
This is fascinating. The #YouthMappers program has blossomed this past year and I’m curious about how that fits into this picture. Maybe we could be the subject of a future look?
Thanks for sharing these!