Almost one year has passed again. This means it’s time for the fourth OpenStreetMap (OSM) member activity analysis. The previous editions are online here: 2014, 2013 and 2012. Simon Poole already posted some interesting stats about the past few years. You can find all his results on the OSM wiki page. However, similar to last year, I try to dig a little deeper in some aspects.
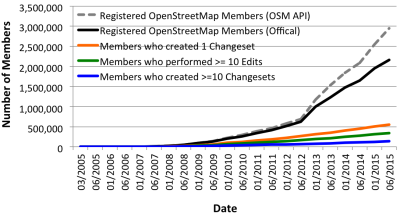
Overall the OSM project has officially more than 2.2 million registered members (Aug, 9th 2015). For several of my OSM related webpages I create a personal OSM contributor database, based on the official OSM API v0.6. Anyway, when using this API, the final table will show a list with more than 3 million individual OSM accounts (Aug, 9th 2015). I’m not sure what the cause for this gap of almost 1 million members between the official number and the member number extracted with the API could be. Maybe some of you have a possible explanation? However, I think many accounts are created by spammers or bots.
The following chart shows a trend similar to the one of previous years: The project attracts a large number of newly registered members, but the sum of contributors that actively work on the project is fairly small. As mentioned in earlier posts, this phenomenon is nothing special for an online community project and has been analyzed for previous years already.
Described in numbers (July 31st, 2015):
- Registered OSM Members (OSM API): 3,032,954
- Registered OSM Members (Official): 2,201,519
- Members who created 1 Changeset: 562,670
- Members who performed >= 10 Edits: 343,523
- Members who created >=10 Changesets: 137,591
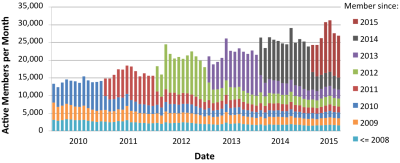
Personally, I really like the following diagram: It shows the increase in monthly contributor numbers over the past few years and their consistencies in collecting OSM data based on the first and latest contributed changeset of an OSM member. It’s great to see that at least some experienced mappers are still contributing to the project after more than five years.
Some background information on how I created the stats: To retrieve the registration date of the members, I used the aforementioned OSM API. The other numbers are based on the OSM changeset dump, which is available for download here.
Next to the presented results above, you can find some daily updated statistics about the OSM project on OSMstats.
Thanks to maɪˈæmɪ Dennis.


Comments
7 responses to “OpenStreetMap Crowd Report – Season 2015”
Thanks for the analysis! I am just wondering why there is this heavy drop for each group after a year of contributing. I would have expected an almost smooth decrease of contributions over the time as you can see it for the two oldest groups (2008 and 2009) where we cannot see what happened at the point when the contributors of the following year started mapping.
Maybe I am misinterpreting that gap, but I suspect that there might be a mistake in the visualization.
One last question: You are working a lot with changesets that you are analyzing in a postgres database. I am quite new to postgres and wondering whether there is a tool to easily import the changeset dump to a postgres database available anywhere.
Up to now, I could only find the following GitHub project: https://github.com/zhm/osmchanges-postgres
Keep up the good work!
I imagine that the graph is correct.
The drop off is when you go into a new year.
Most contributors only make 1 edit or a few in a short period of time.
So dec 2014 there are say 10k contributors all in the grey colour as they all registered in 2014, the vast majority of these are new. In Jan 2015 there are only a few thousand that registered in 2014 that contributed again. Where there are say 10k new users all of them new.
Hope that helps
Good point! That should be the correct interpretation! Thank you.
you could try to make the y-axis in the first diagram logarithmic, so the amount of users with a lot of changesets (>100, >1000, … could be added and still be visible
[…] skal nævnes at Pascal Neis lige har lavet sin årlige brugerundersøgelse af OpenStreetMaps frivillige og i hovedtræk er konklusionerne i […]
would be interesting to know the number of editors as a function of effort. effort could be measured as the number of nodes they create
That’s a great idea!
There is already one way of classifying the contributors, but it is based on the changesets. This does not correctly reflect the actual mapping effort: If a mapper has the habit of saving more often, the number of changesets goes up.
IMHO each POI and shape (closed way) should be considered equivalent effort, as both actions add roughly the same value to the map.
It would be great to see a chart with the number of different types of contributors from each country. Something like the medal tally at Olympics.
http://static.guim.co.uk/sys-images/Guardian/Pix/pictures/2012/8/6/1344281788803/Alternative-medals-table–008.jpg