In 2010, I started “How did you contribute to OpenStreetMap?” (HDYC) as a fun side project. Even after more than 15 years, it is still great to see that this website is being used by so many people from the OSM community and even in academic research.
Some features were implemented based on community feedback. Others were simply features I thought might be useful, so I just built and deployed them without much prior discussion. From time to time, I also like to draw inspiration from GitHub and other platforms. That is how the first version of the heatmap calendar on HDYC came about back in 2016, to make mapping activity more visible. More precisely, on August 5, 2016: greetings to Harry, even though we have never met in person. Since early 2025, a similar calendar has also been integrated into the default OSM profile page. Like the one on HDYC, it shows editing activity by weekday over the last 365 days.
For many people in the OpenStreetMap project, however, it is not just about mapping itself, but about many other activities around the project. That is why I decided to implement a new version of the calendar on HDYC. In this first version, it is called “OSM Activity.” In my view, this makes it easier to quickly see when a user was particularly active — not only in mapping itself, but also in other OSM-related activities such as changeset discussions or note handling.
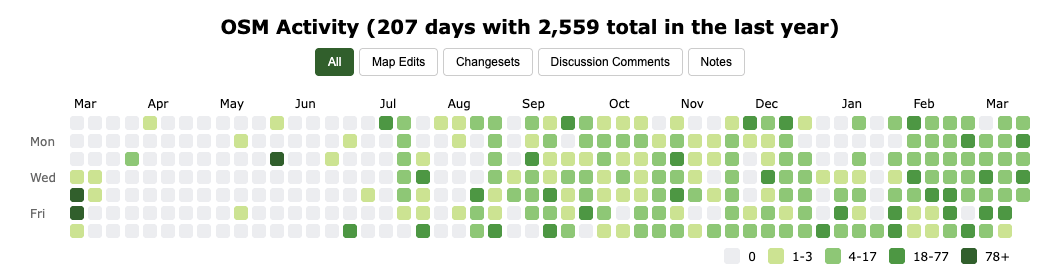
What does the calendar show? In addition to daily changesets, there are now also categories for:
- map edits
- changeset discussion comments
- note activity
The individual calendars on my server are no longer updated through a database trigger whenever a user contribution comes in, but instead through a job that runs every five minutes. So please do not think of the calendar as a live monitoring tool. If there is a strong need for that, I can still add it, but I wanted to reduce the number of triggers in my data processing.
For many years, there was also repeated interest in having an “OSM streak” shown on my site as a motivational indicator for mappers. The OSM Streak website already exists, but I decided to calculate this metric myself. As a result, the website now shows not only a contributor’s current streak, but also their longest streak. Since an OSM infrastructure outage or maintenance can interrupt a streak through no fault of the user, the following days are excluded from the calculation: 2006-05-03, 2009-04-18, 2009-04-19, 2009-04-20, 2010-07-02, 2012-04-02, 2012-04-03, 2024-12-16. If a day is missing here due to maintenance or a similar issue, please let me know.
What’s next? The HDYC website currently still includes detailed charts showing the frequency of contributions by day and by hour. I plan to remove these two charts soon, unless there are major objections from the community that strongly favor keeping this information.
As I mentioned at the beginning, this project was created with the idea of making as many aspects as possible of a member’s OSM contributions visible. My guiding principle was always to evaluate and display everything contained in the OSM data. However, recent technological developments have made me reconsider this approach. We should not make ourselves fully transparent online. My future direction will therefore be to focus more strongly on current user statistics — for example, the last 14 days or the last three months — instead of showing the full activity of the past 20 years by default.
The recently added username history has therefore been limited to username changes from the last three months. I received several messages from users asking for this, especially because earlier versions of their username included their real name.
Happy mapping!
Comments
3 responses to “Beyond Mapping with the OSM Activity Calendar”
Hi Pascal,
thanks for all the results maps 😀
Quick info: Seems like OSM fight is broken right now, the backend returns a 500.
Best,
Malte
Hi Malte,
Thanks for your feedback. I think I accidentally broke something this morning while working on the latest HDYC improvements. OSMfight should be fixed now.
Best regards,
Pascal
[…] Neis has introduced a new ‘OSM Activity’ calendar to his ‘How did you contribute to […]