Contribution in percentage
by Pascal Neis - Published: October 10th, 2010
Some time ago I saw a diagram on the OpenStreetMaps statistics pages which showed the contribution of OSM Data by contributor in percent (here). This diagram was created last year (2009).
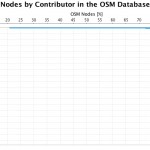
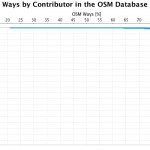
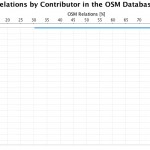
I tried to repeat this interesting analysis with the latest OSM data to see if there have been any significant changes. The following diagrams show the results of this analysis using the mid-august OSM data. The last modifier of an object is being considered as owner. (I think it has been handled the same way in the diagram of 2009?)
The results are more or less identical to the ones from last year. 98% of the OSM data are distributed on almost 10000 contributors in 2009 and 12000 contributors in 2010.
Based on my “How did you contribute to OpenStreetMap ?” and the used full planet dump (08/01/2010) I tried to create the same diagrams but based on the contributor who created the objects (version=”1”). The results are as followed:
I personally expected that the diagrams would change based on the questions “Who created the object?” and “Who worked on the object the last?”, but one needs to take a very close look to determine the differences within the stats. This means that more or less just about 12000 members have been working on the DB and contributed most of the data … what do you think?
thx @ dennis


[…] This post was Twitted by pascal_n […]
[…] This post was Twitted by bitsteller […]
[…] This post was mentioned on Twitter by Pascal Neis, Nils. Nils said: RT @pascal_n: New blog post: Contribution in percentage http://neis-one.org/2010/10/10/contribution-in-percentage/ #OSM […]