Tag: YOSMHM

Your Explored OSM World

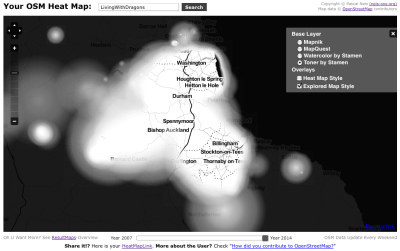
Gregory Marler had the great idea to implement an “explored” map, based on a concept that some of you might know as “fog of war” from strategy video games. So here you go: I extended my OSM Heat Map with the “Explored Map Style”. It essentially reveals the contribution areas of an OpenStreetMap member in a “fog of war” style. The following figure shows Gregory’s amazing “explored” OSM map.

ExploredMapStyleToner

The Heat & Explored Maps are available for almost all OSM members who contributed at least several changesets here: http://yosmhm.neis-one.org (The new “Explored Map Style” can be selected in the layer panel (upper right corner). Additionally, I added the awesome looking and well known Watercolor and Toner map styles from Stamen design)

Thanks to maɪˈæmɪ Dennis
TimeSlider for “Your OSM HeatMap”

During my really great vacation in Sweden I had some time to do some further adjustments to the well-known “Your OSM Heatmap“-webpage. For the new readers: “Your OSM Heatmap” shows the contributions of an OpenStreetMap user as a heatmap overlay. You can find my blog post with some more information here.

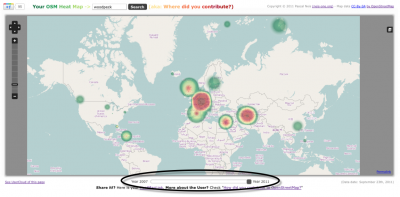
However, I think it would be a fantastic idea to add a time slider to the webpage. You can find it now below the map! The year of your first and last contribution is on the left and right end of the slider. With the slider you can visualize your OSMtastic-work over time. The following image shows the webpage including the time slider:

As a second feature you can now use, beside your OSM heatmap-link, the permalink of the map to point to an individual position of your heatmap! Finally I have updated the data for the webpage with the latest OSM changesets. Overall the heatmaps for about 150 000 contributors are available. Remember: Not *every* registered OSM member did contribute to the project.

“Your OSM Heat Map” (aka Where did you contribute?)

Last week Stephan released the neat “Where Did You Edit?” webpage. A world map indicates where in the world you have been editing OpenStreetMap (OSM) nodes. Unfortunately it is based on a full history OSM planet dump which is nearly two months old. Also, the map does not include any tools to zoom into or drag the map. However, Stephan mentioned that he is working on these functions. Keep up the good work, Stephan!

Based on my OSM changeset table of “How did you contribute to OpenStreetMap ?” I created a slightly different webpage and used a different approach. I used the weekly OSM changeset files and I presented the results in an OpenStreetMap including zoom and drag functions. Your contributions are indicated by a “Heat-Map-Overlay”. For this overlay I am using Bjoern’s OpenLayers addon. For better performance I generalized the total changesets of each OSM contributor. This means that it is possible that not every little contribution from a member is taken into account and displayed in the map. Anyway, I think the results are quite impressive, aren’t they?