Using OpenHeatMap
Nearly three months ago I saw a tweet by mapperz (here). The tweet introduced http://www.openheatmap.com (OHM) : “Turn your spreadsheet into a map” . A very interesting tool. Unfortunately I completely forgot about it in the past weeks until last night. I was looking for an easy method to present some data on a map.
Using OHM is really simple. Upload your CSV file, which suits a certain format, and your data is more or less presented on an OpenStreetMap basemap 🙂
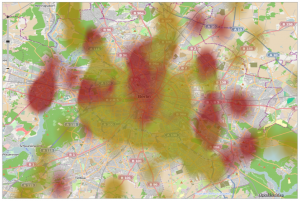
In my case, I used the TMC data of Germany for one week (since 2010-09-12) to present it on a map. For each intersection I counted the number of traffic messages for that specific week. The red areas in the map represent those intersections with a high concentration of messages. My result-OHM-map can be found here: http://www.openheatmap.com/view.html?map=OverestimatedOdessasShevat
The visualization of the CSV file looks pretty cool, doesn’t it? Especially the Berlin area shows a very nice representation of TMC messages.
