Tag: World

OpenStreetMap Crowd Report – Season 2015

Almost one year has passed again. This means it’s time for the fourth OpenStreetMap (OSM) member activity analysis. The previous editions are online here: 2014, 2013 and 2012. Simon Poole already posted some interesting stats about the past few years. You can find all his results on the OSM wiki page. However, similar to last year, I try to dig a little deeper in some aspects.

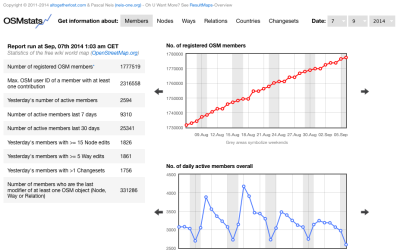
Overall the OSM project has officially more than 2.2 million registered members (Aug, 9th 2015). For several of my OSM related webpages I create a personal OSM contributor database, based on the official OSM API v0.6. Anyway, when using this API, the final table will show a list with more than 3 million individual OSM accounts (Aug, 9th 2015). I’m not sure what the cause for this gap of almost 1 million members between the official number and the member number extracted with the API could be. Maybe some of you have a possible explanation? However, I think many accounts are created by spammers or bots.

Counting changes per Country – A different approach

OSMstats contains several statistics about the OpenStreetMap (OSM) project, such as daily-created objects, the amount of active contributors or detailed numbers for individual countries. One way to determine the sum of created or modified Node objects, is to use the minutely, hourly or daily OSM replication change files and counting the values for each country of the world. Sadly, this approach has some drawbacks. Firstly, the official files do not contain, for example, all Nodes of a modified way, which is required, when trying to find the country where the change took place. Furthermore, the determination of the country for a specific OSM object really depends on the border’s level of detail: More detailed country borders make the processing quite time-consuming. Some of you probably experienced this problem before when using Osmosis or a different OSM processing tool. Anyway, for calculating additional country statistics I tried a new approach:

  1. Determine the country of a changset based on its center position
  2. Use the changeset country information for all objects within this changeset.

489 Pages about OpenStreetMap

The first book about the OpenStreetMap (OSM) project was written by Frederik Ramm and Jochen Topf, two well-known OSM enthusiasts, in 2008. The first version was in German which was later translated into an improved English version. It contains similar information as can be found in the book by Jonathan Bennett, which was published in 2010, detailing how the projects’ geodata is collected, which editors can be used, some explanations about tags, key and values and how the rendering stack works. Both books are great resources to learn about the OSM basics and to get an overview about useful software.

However, besides these more technical books, the research community has been very active in recent years and has published several articles about OSM data quality, conflation attempts with other datasets or about the contributors of the project. Each of us (Dennis Zielstra and I) wrote a dissertation with different aspects about crowd-sourced geodata and the OSM project: Dennis’ work is about OSM data quality in comparison to proprietary and governmental data with emphasis on pedestrian shortest path routing and data imports. Pascal’s work tackled the issue of how user-generated geodata can be utilized for disabled people friendly route planning. Both dissertations contain more than 13 publications in total.

Visualizing the #MissingMaps OpenStreetMap Contributions

The Missing Maps project is a collaboration between the Humanitarian OpenStreetMap Team (HOT) and various partner agencies, such as the American or the British Red Cross. One of their main objectives is “to map the most vulnerable places in the developing world, in order that international and local NGOs and individuals can use the maps and data to better respond to crises affecting the areas.” You can find additional information about the Missing Maps Project on the OpenStreetMap (OSM) wiki and their project page.

A year ago, I created a webpage where you can filter OSM changesets by a specific comment. Sadly the webpage provides only a search for the latest seven days. However, the Missing Maps project asked me, if it’s possible to “look over a longer time scale”? Here we go, based on a similar concept that I used for a webpage that I created for the HOT Ebola Response, I made a Map that displays all OSM changesets which have the hashtag #MissingMaps in the comment attribute and have been created since August 1st, 2014. It’s online here and being updated on an hourly basis: http://resultmaps.neis-one.org/osm-missingmaps

Ebola Response Map and OSM contributor analysis

For almost eight months the OpenStreetMap (OSM) community has been collecting geo information for the West Africa Ebola outbreak response now. The collective work of the crowd is somewhat managed by the Humanitarian OpenStreetMap Team (HOT). For example, the Task Manager provided by HOT gives interested contributors information in which areas map features are needed. However, you can find additional information in an article by Pierre Beland, which he wrote during a conference where he presented the efforts of the OSM community. The OSM wiki contains some useful information about the West Africa Ebola Response too. Matt Irwin also wrote a summary about the OSM mapper contributions and created an interesting visualization of all the mapping work.

I created a response map for the OSM mapping activities in West Africa, a similar approach as I previously used for the “Typhoon Haiyan” deployment. It displays all OSM changesets created since March 1st, 2014. The analysis extent is displayed by a black rectangle. In total, more than 2,000 contributors made more than 10 million changes to the map. At the bottom you will find a time range slider which can control the displayed changesets. Sorry for the sometimes slow performance, but the community (maybe you too) collected a huge amount of data! The map is online here: http://resultmaps.neis-one.org/osm-ebola

Your Explored OSM World

Gregory Marler had the great idea to implement an “explored” map, based on a concept that some of you might know as “fog of war” from strategy video games. So here you go: I extended my OSM Heat Map with the “Explored Map Style”. It essentially reveals the contribution areas of an OpenStreetMap member in a “fog of war” style. The following figure shows Gregory’s amazing “explored” OSM map.

ExploredMapStyleToner

The Heat & Explored Maps are available for almost all OSM members who contributed at least several changesets here: http://yosmhm.neis-one.org (The new “Explored Map Style” can be selected in the layer panel (upper right corner). Additionally, I added the awesome looking and well known Watercolor and Toner map styles from Stamen design)

Thanks to maɪˈæmɪ Dennis

Welcome to an additional family member – OSMstats

Maybe some of you are already familiar with “OSMstats”, a website that provides numerous statistics about the OpenStreetMap (OSM) project. The site was created and is maintained by the two guys at altogetherlost.com. However, OSMstats has now been moved to the ResultMaps domain at osmstats.neis-one.org. I added several new features too. First of all, you can now select a specific date for your stats. Secondly, the main menu panel has been extended with a new entry for statistical information about OSM changesets.

osmstats

Additionally, the graphs for the country statistics, the active members and daily edits are also available in a “year”-overview. I hope you like the new extensions. A big thanks to both guys at altogetherlost.com who originally created OSMstats!

OSMstats is now available at: http://osmstats.neis-one.org
Feel free to check out my Resultmaps too which offer many helpful and funny OSM tools: http://resultmaps.neis-one.org

Notice: OSMstats was introduced in 2011, this means the webpage cannot provide statistics prior to that year. Also, the newly created Changeset-Tab has only data for July, 2014 and after.

The OSM Contributor Activity Report – Edition 2014

The OpenStreetMap (OSM) project celebrated its 10th anniversary in August 2014. For almost 10 years it has increased its number of registered members. Even though some contributors stopped their contributions to the project, each day new mappers start collecting features for the free wiki world map (aka database).

In my last contributor report in 2013, the OSM project had a total of 1.3 Mio registered members. For July 2014 this number has increased to almost 1.6 Mio registered members. Similarly to last year, I checked how many contributors created one or more than ten changesets or performed more than 10 map edits. This information can be retrieved from the changeset dump.

NewContributorsPerMonth.201408

The figure above reveals a similar trend to the ones we saw in the past few years: Less than 1/3 of the 1.6 Mio registered members actively contribute to the project (450,000 members). Furthermore, only a small group of 16% (270,000) or respectively 6% (100,000) of the contributors performed more than 10 edits or 10 changesets.

A précis: Where are the US mappers at?

This blog post is a summary of Dennis’ and my State of the Map (SotM) United States presentation. Maybe some of you already know about our publication: “Comparison of Volunteered Geographic Information Data Contributions and Community Development for Selected World Regions”. From the abstract: “Our findings showed significantly different results in data collection efforts and local OSM community sizes. European cities provide quantitatively larger amounts of geodata and number of contributors in OSM …”. “Furthermore, the results showed significant data contributions by members whose main territory of interest lies more than one thousand kilometers from the tested areas.” Especially the last finding is quite interesting when considering “arm-chair-mapping” in OSM.

However, for our SotM US session we repeated some of the conducted analyses for 50 urban areas in the United States to see whether similar patterns could be determined. You can find the session abstract here; additionally the ppt slides and also a video are online. The following animation shows the number of contributor’s evolution in the US from 2007 to 2014.

Filtering OpenStreetMap Changesets by a Specific Comment

In my last blog post I showed that OpenStreetMap (OSM) changesets offer a great opportunity to visualize the latest changes to the OSM map or to compute some up to date descriptive statistics of a particular region (Typhoon Haiyan OSM Response Map). Oftentimes OSM contributors use tags, comments or hashtags in their changesets to provide additional information about the features they mapped. For example it is quite common to add a specific hashtag, such as #notlm (Night of the living maps), to the changeset comment to link to a mapping party or another event. To filter or collect changesets with these notations, I developed a new webpage: http://resultmaps.neis-one.org/osm-changesets

osm-changesets